Retail turnover of retail trade enterprises in Ukraine, according to the State Statistics Committee, in June 2015, compared to June 2014, decreased in comparable prices by 24%, to UAH 38.721 billion. The FMCG market, in the context of decreased purchasing power of the population, continues to struggle even more for each client. The main tool that influences the choice of buyers, along with the assortment and profitable promotional offers, is the display.
When entering a supermarket, perfume store or pharmaceutical market, the buyer encounters sections and shelves on which there are certain categories, which change with each section, thus forming the buyer’s route. What approaches do retailers and manufacturers use today? What are the main layout problems? And what should retail do to increase its efficiency?
The majority of products in the world use branded (vertical, horizontal) or flavor displays. The main purpose of the display is to ensure the buyer’s comfort when searching for goods, to guarantee the availability of goods on the shelf, to avoid out of stock, and also to increase profit from the shelf.
It is important to understand that display is not only a beautifully arranged product that harmonizes on the shelf - it is, first of all, turnover, sales and a loyal customer.
What are the main layout problems that exist today?
1. A unified approach to the principles of layout.
2. Insufficiently developed area of category management projects.
3. Lack of effective shelf space management tools.
4. Out of stock.
5. Unconsolidated approach to working with assortment.
6. Unsystematic control over display at sites.
Retail often uses a unified approach to display within its outlet. It is important to understand that the display will give results only if sales increase, which, in turn, depends on the buyer. And the buyer can react to the shelf only when it is comfortable and pleasant for him to spend time and money there.
The buyer is comfortable only if he can easily find the product he needs without wasting energy, and especially nerves, searching for it.
The main conclusion: any category within a store should be based solely on the opinion of the buyer, or, as it is called, a decision tree. It is important to understand how the buyer sees this category, what he looks for first - brand, taste, packaging.
So, for example, in the “Wine” position the first choice is not the brand, but the country of origin, and in the “Chocolate” category the first choice is the brand.
In the “Creams” category, a branded display would also be a mistake, especially if the buyer is a man with a list, since such a display will force him to spend a lot of time and effort.
It is the separate distribution of creams for the face, hands and body, and feet on shelves, and segmentation by brand within this category that will help achieve the desired result and the desired effect.
2. Insufficiently developed area of category management projects
How did category management emerge in the world?
– Retailers are faced with high competition.
– Manufacturers and retailers conducted a dialogue only about the terms of contracts.
– Manufacturers and retailers could not find a “common language”: brands VS categories.
Retailers did not have the time or resources to conduct in-depth research on their customers.
2/3 of purchasing decisions occur directly in the store.
A buyer could come to a store and see such a shelf (Fig. 1).

Business has come to the conclusion that:
– it is necessary to focus on consumers to increase the performance of the entire category as a whole;
– Manufacturers, in addition to studying brands, invest in studying categories and consumer behavior;
– the focus shifts from discussing only prices to discussing how to improve the overall consumption of the category;
– retailers can use deep knowledge of producers, consumers and buyers of the category;
– manufacturers and retailers are developing a new model of interaction with category management.
1995: US ECR Category Management Best Practices Report based on The Partnering Group model.
2000: The Essential Guide to Day-to-Day Category Management ECR Report.
2006: Consumer Centric Category Management book by Nielsen.
It was then that the basic definition of category management was formulated.
CatMan is a collaborative process Supplier And Retailer on management Categories as strategic business units to improve economic performance by effectively responding to requests Buyers this category.
CatMan quickly took root in Europe, having a number of advantages:
For Buyers:
– division into categories from the point of view of buyer logic,
– high level of satisfaction from making a purchase;
For Retailer:
– improving the store’s image,
– increasing customer loyalty,
– attracting new customers,
– improvement of economic indicators;
For Suppliers:
– increasing the level of expertise in the category,
– closer relationship with the retailer,
– improvement of financial performance.
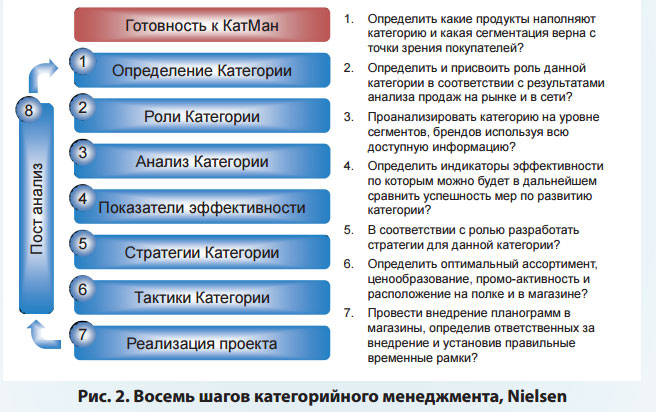
Nielsen identifies eight key steps for effective category management (Figure 2).
3. Lack of effective shelf space management tools
It is no secret that many companies continue to draw category planograms using various tools - from point, excel to special programs and their own developments.
This affects not only the time spent by a specialist on drawing the planogram, but most importantly, the economic and financial feasibility of the presented number of SKUs on the shelf.
Nielsen is a developer of shelf space management software. For more than 40 years, customers around the world have known and used this tool to optimize shelf space and increase efficiency.
Spaceman software helps create planograms (layout of goods on equipment), and also allows you to use financial indicators when creating displays, analyze ready-made planograms, how effective they are, create your own reports for each article on key KPIs - turnover, profitability, inventories, brand blocks (Fig. .3).

Spaceman has 3 levels that differ in functionality:
Merchandiser - the basic version, allows you to create a planogram and build a report on the space used.
Stock Planner is an intermediate version that allows you to create a planogram, display an analysis based on one criterion (financial or characteristic), and build a report in any convenient form (xls, chart, etc.).
Professional is an advanced version of the program that allows you not only to create a planogram and build a report based on specified characteristics, but also:
– display an analysis based on one or several criteria simultaneously;
– show the dynamics of changes in the main financial indicators when the calculation changes;
– proportional filling of the rack according to the required criterion (share, sales in UAH or units, profit);
– visualization of additional information on the planogram itself (labels);
– visualization of the finished planogram in a form convenient for you (straight, sideways), as well as accompanying it with the necessary reports.
Database integration is required to automatically link the database with the Spaceman software.
When updating information about new / deleted articles, about changes in their characteristics, all new data will be automatically updated in Spaceman (prices, sales, physical dimensions, description, etc.).
The My.Spaceman shell allows you to effectively use the information from previous modules for further work (Fig. 4): financial forecast, creating your own formulas, auto-layout based on criteria (share, sales, profit).
My.Spaceman Publishing – allows you to publish certain planograms, reports to the necessary stores, convert reports to pdf, xls.
My.Spaceman Productivity Tools – allows you to delete, replace and add inventory to a large number of planograms without even opening them.
My.Spaceman Reports – allows you to use a reporting system that includes ready-made reports, the settings of which can be changed.
My.Spaceman Analysis – allows you to generate data for downloading and further use in Adviser.

Store Planner
This module allows you to visualize the store plan, create a connection between the planograms of each rack, as well as other store premises with the plan, and analyze the effectiveness of assortment placement based on the analytical data of the planograms. The visual display of analysis results is similar to the functions of Spaceman Professional (Fig. 5).

4.Out of stock
It is important to remember that the reason for a drop in sales or a slowdown in their growth can be something as simple and trivial as the lack of goods on the shelf. That is why it is necessary to use tools that allow you to optimally and correctly calculate the stock on the shelf of each article, taking into account individual turnover.
Do not forget that according to the results of the Shopper Trends study, 32% of customers, if they do not find a product in one store, will buy it in another, which is a serious threat to the retailer in switching the client to a competitor’s store. And 20% will replace the missing brand with another, which is very negative for the manufacturer (Fig. 6).

That is why inventory accounting when building a shelf is an increase in income through effective inventory management. Namely:
– introduction of new product items – the ability to timely control the availability of goods;
– current product items – in stock and sold in the indicated stores;
– promotional activities – sales management by controlling under/oversupply.
Reduced inventory costs:
– basis for better forecasting with more relevant demand information;
– adjusting the ordering process to maintain correct inventory levels in stores and distribution centers.
Maintain or improve the level of service:
– confidently balance warehouse inventory and product availability;
– improve relationships with customers and consumers.
Build brand equity:
– gain confidence that the buyer is not disappointed in front of the shelf;
– reduce the number of samples of alternative products by buyers.
Historically, as retail developed, the development of functions within it was ensured - buyers, logisticians, planners, marketers, merchandisers. However, the lack of common tasks or direct communication between functions can sometimes create difficulties for the specialists who are responsible for drawing planograms (most often this is the merchandising department). Due to the lack of up-to-date information from the purchasing department, a product that has already been withdrawn or has been removed from the assortment may, as a result, be planogrammed.
This is why in some companies the purchasing department is responsible for drawing planograms in their categories. Where this is not possible, companies should ensure that there is active communication between departments, even down to their proximity in terms of office location.
6. Unsystematic control over display at sites
A planogram drawn at the central office never guarantees that the calculated forecast will be achieved. The main reason influencing the achievement of the calculated result is local control over the layout.
It is very difficult for both manufacturers and retailers to monitor compliance with the rules and principles of display by employees in all selected stores throughout the country.
Therefore, the presence of supervisors, a cross checking system or a quality contractor - a third independent party - can help achieve the goals.
Display is very complex and time-consuming, but, of course, one of the key attributes influencing the buyer when choosing a store. A display built on the basis of a decision tree in a convenient tool that can easily adapt to the format of a retail outlet, shelf, equipment, taking into account inventory, turnover and profitability, will help a business achieve the main thing - to get a satisfied, loyal customer!
Vitaly Bryk,
Director of Strategic Development at Nielsen (Ukraine, Belarus)
The training program included the latest CM methods and tools - planning and control methods; analysis and optimization of the pharmacy chain’s assortment; managing the profitability of retail and exhibition space; developing and implementing a category development strategy and much more. So, let's take a closer look at the main QM analyses.
ROLE ANALYSIS
This analysis is used to assess the sustainability and competitiveness of the category. It is carried out by categories and groups of homogeneous goods (types, brands). The dynamics of role analysis reflect the rotation of assortment in the category. The category contains all products of 6 main roles (Fig. 1). After conducting a self-conducted role analysis for specific product categories, participants found that in most cases the categories did not contain any of the 6 main role products (either protector or cash generator). In order to correctly conduct a role analysis, it is necessary to determine the trade margin and turnover for each brand and assign a role (Table 1). Next, based on the obtained values, you should build a graph (Fig. 2) and analyze whether the markup and role are correctly determined for all positions.
| Brand | Trade margin, % | Role meaning | |
|---|---|---|---|
| Brand A | 8 | 1 860 | Flow generator |
| Brand B | 25 | 1 500 | Cash generator |
| Brand C | 25 | 1 040 | Cash generator |
| Brand D | 18 | 835 | |
| Brand E | 42 | 420 | Profit generator |
| Brand F | 36 | 540 | Purchase generator |
| Brand G | 15 | 320 | Delta* |
| Brand H | 21 | 700 | |
| Brand I | 24 | 800 | |
| Brand J | 45 | 120 | Image generator |
| Total | 8 135 |
Delta is a brand or product position located in the lower left corner of the matrix. Delta meets the standards of the EPP retail network


At the first stage of the analysis, the “sustainability” and “sufficiency” of the assortment are assessed.
It is known that in order to generate maximum turnover and profit, the category requires the presence of goods of 6 main roles.
Flow generators are branded, branded products that are well known in the market due to active marketing by the manufacturer.
Since these goods are presented in all retail chains in the city, the consumer, as a rule, has a good understanding of sales prices. Accordingly, the markup for these goods is set at the level of “average” or “slightly below the average” for the market. The main task of flow generators is to generate a flow of customers to stores. Trade turnover for flow generators is high and above average in the category.
Cash generators are lesser-known, perhaps unbranded, products that are analogous to flow generators.
Retail prices for the cash generator are slightly lower than for the flow generator; but the markup is much higher. The manager's task is to raise sales of the cash generator to the level of the flow generator and higher.
Purchase generators - the entire range of goods of impulse and passive demand; related products.
Purchase generators have an “above average” markup for the product category and work to increase overall profitability and increase the number of purchases in a receipt.
Profit generators are products with high markups and a significant share of sales in the product category. Most generators in the category work to support them.
Image generator(s) - products that allow you to position the category range on the market and in the minds of consumers. May have the following characteristics:
- maximum markup, insignificant sales volume (rare, exclusive goods); available in the supermarket assortment;
- minimum markup, significant sales volume (consumer goods, “loss leaders”); available in the discounter's assortment.
Defender is a product sold only by one retail operator in the region (exclusive contract, private label of the chain) or on unique terms. Allows you to retain the main pool of consumers even with the aggressive assortment policy of competitors. It may have fundamentally different characteristics in terms of markup and sales volume.
At the second stage of the analysis, the area of the figure is estimated using role analysis. An increase in area may indicate:
- changes in sales volume of generators in the category;
- changing the trade markup for category generators;
- the emergence of new generators, that is, the rotation of the assortment.
Most changes in the area of a figure according to role analysis are associated with the appearance of new (additional) generators in the category. The manager either immediately introduces the leading product with the maximum turnover and (or) markup into the category; or introduces a new product into the range, planning that someday it will move to the upper right part of the matrix.
But since store shelves are “not rubber,” introducing new products into the assortment is only possible if inappropriate product items are removed from the assortment matrix (lower left corner according to role analysis).
Thus, an increase in the figure area guarantees constant rotation of the assortment and confirms that the increase in turnover and profits occurred not only due to marketing, consumer market growth or inflation, but also due to optimization of the assortment structure.
structural analysis of the assortment. optimal depth
How to calculate the number of required product items (SKU-Stock Keeping Unit) included in the category at which the pharmacy will receive maximum turnover or maximum turnover? In addition to ABC analysis, this can be done using structural analysis, which the training participants also performed in practice. Structural analysis allows you to calculate the optimal structure of the assortment, that is, the number of groups, subgroups, brands, articles; their renewal and ratio, at which maximum turnover and profit are achieved.
Structural analysis is based on the calculation of the following assortment indicators:
- category breadth - the number of groups included in the category (subgroups, species, varieties);
- category completeness - the number of brands included in the category (group, subgroup);
- category depth - the total number of product items (articles, SKU);
- category harmony - the degree of similarity of product items in the price range;
- category stability - fluctuations in the main indicators of the category assortment for the analyzed period;
- category renewal - the number of new product items in the assortment structure (for the analyzed period).
At the first stage of the analysis, the optimal values of the indicators are calculated. To do this, the weekly values of turnover (or any other indicator, for example, profit, turnover) are compared with the corresponding value of the assortment indicator. Depth data (number of SKUs) provides information about the products that were in stock in a given week. The comparison is made at least 12 weeks in advance (Table 2). Based on the results of data comparison, a dot plot is constructed (Fig. 3). A trend line (polynomial trend) is added to the graph. The transition point is determined on the trend (after which the growth in trade turnover slows down). The transition point is the optimal value of the indicator for a given season.
| A week | Depth, number of sku | Weekly turnover, thousand rubles. |
|---|---|---|
| 1st | 102 | 5300 |
| 2nd | 80 | 3500 |
| 3rd | 110 | 4800 |
| 4th | 90 | 4500 |
| 5th | 75 | 3750 |
| 6th | 85 | 4250 |
| 7th | 100 | 5400 |
| 8th | 142 | 5100 |
| 9th | 125 | 4700 |
| 10th | 80 | 4000 |
| 11th | 135 | 5000 |
| 12th | 85 | 4250 |
| 13th | 135 | 4400 |
| 14th | 110 | 4870 |
| 15th | 130 | 4800 |
| 16th | 140 | 5050 |
| 16th | 118 | 4100 |

In this case, the optimal category depth is in the range from 110 to 120 SKU (for a particular season).
Structural analysis should be calculated once a season. After calculating the optimal assortment indicators, the category manager reports weekly to the commercial director for deviations of the current indicators from the optimal ones. It is recommended to use the analysis for a homogeneous group of products.
harmony in price level
How to determine how many SKUs should be in the low, medium and high price segments in a product category? The traditional method of determination is by demand. And under what structure will we get maximum turnover or income for a specific product category? Analysis of the harmony of the assortment by price level (analysis of the price line) by category and subgroup allows us to determine whether the cost of brands in the category is harmonious.
The result of the calculation is the value of harmony for 1 week for specific products. As an example, the beer product line was chosen (Table 3). At the first stage, it is necessary to list all product items included in a specific product group. Next, you should choose a product with the minimum price - in this case, it is the Stary Melnik beer with a cost of 18 rubles. And then calculate the ratio of the cost of each product and the minimum price and determine the arithmetic average. Thus, to analyze harmony by price, you need to know:
| No. | Name, “beer, glass, 0.5” | Cost, rub. |
|---|---|---|
| 1 | Baltika No. 3 | 20 |
| 2 | Baltika No. 5 | 25 |
| 3 | Baltika No. 5 | 28 |
| 4 | Old Miller | 30 |
| 5 | Klinskoe light | 24 |
| 6 | Klinskoe dark | 27 |
| 7 | Staropramen | 32 |
| 8 | Zhigulevskoe | 34 |
| 9 | Old Miller | 18 |
| 10 | Heineken | 38 |
- optimal value of the characteristic (sign);
- the ratio of each characteristic to the optimal characteristic;
- the arithmetic mean over all ratios (over all division results).
Thus, a formula for price harmony was derived using the example of beer products: Gm (Ai) = (20 / 18 + 25 / 18 + 28 / 18 + 30 / 18 + 24 / 18 + 27 / 18 + 32 / 18 + 34 / 18 + 18 / 18 + 38 / 18)/10.
In this case, the price harmony was 1.5. If harmony is about 1, this means that all goods are sold at the same price and the needs of one price segment of consumers are satisfied. The greater the harmony - 2, 10, 15 or higher, the greater the difference in prices, which means it is possible to satisfy consumers in different price segments. Optimal harmony is the one at which you can get maximum turnover or profit. One indicator of harmony for 1 week (1.5) is not enough. In the same way, it is necessary to calculate the harmony for the 2nd, 3rd, 4th week, etc. Based on the results obtained, a structural analysis should be carried out to see on the graph the point at which maximum turnover or income can be obtained for a given variety.
The number of weeks should be about 16 (as many weeks as there are in the season), then you need to calculate the arithmetic average. For example, if the optimal value - the peak point on the graph - is 5, and in the current period the harmony is 4.5, then the category manager manually, according to role analysis, includes or displays some product items in order to “pull up” the harmony indicator to 5. Harmony is necessary so that in the future, when introducing or introducing any product categories, the products will not be positioned.
ABC analysis
“If you want to kill the assortment, do ABC analysis,” V. Snegireva told her students. But this statement did not shock them. ABC analysis is a statistical method of analysis based on Pareto's law - a smaller number of causes are responsible for most of the results. ABC analysis allows you to understand which products are sales leaders and which, on the contrary, are outsiders. But ABC analysis will never show why some product items moved up in the rankings, while others moved down. Perhaps the category managers did this on their own, moving their positioning areas, or perhaps it was caused by a seasonal decline (or if it was a new product, etc.). And most importantly, the goal of ABC analysis is to optimize the product range. It is logical that those positions that are at the bottom of the list in terms of share in the category should be excluded. Such eliminations can be carried out weekly, but as a result they can be further optimized until only one product item remains. V. Snegireva showed photographs taken in a supermarket, where the assortment of the “sunflower oil” category consisted exclusively of “Oleina” oil. ABC analysis is necessary only for determining and controlling inventory, but not for managing sales. ABC analysis should only be used in conjunction with XYZ analysis.
ABC analysis with merchandising index
How to understand what influenced the increase in sales of over-the-counter products or their decrease? This requires ABC analysis with the merchandising index - ABCi, which allows you to take into account factors such as the number of the shelf on which the brand is located and the share of shelf space occupied by the brand in the group. It allows you to see how brands could sell if they were displayed at the same height above the floor and occupied an equal position on the shelf.
The merchandising index helps to equalize sales from different shelves. It shows how items would sell if they were on the same shelf. As a rule, the bottom shelf is equal to 1.4, the next one up is 1.0, at eye level 0.8 or 0.6, the top - 1.2. If the equipment is three-shelf and 40 items were sold from the 1st shelf, 100 from the 2nd, and 80 from the 3rd. The total is 220 items, which equates to 100%. Next, you should calculate the share of each shelf, which will be the merchandising index. ABC analysis formula with merchandising index:
АВСм=Т · Im · 1 / TO, Where
T- current trade turnover;
Im- merchandising index;
TO- the share of exhibition space occupied by a product (brand) on equipment.
| Brand, SKU | Brand turnover, thousand rubles. | Brand share in group turnover | Share from accumulated as a result | ABC analysis group | ABCi analysis group |
|---|---|---|---|---|---|
| Brand A | 420,00 | 0,14 | 0,14 | A | C |
| Brand B | 380,00 | 0,12 | 0,26 | A | B |
| Brand C | 340,00 | 0,11 | 0,37 | A | B |
| Brand D | 290,00 | 0,09 | 0,47 | A | C |
| Brand E | 270,00 | 0,09 | 0,55 | B | C |
| Brand F | 250,00 | 0,08 | 0,63 | B | B |
| Brand G | 230,00 | 0,07 | 0,71 | B | A |
| Brand H | 220,00 | 0,07 | 0,78 | B | C |
| Brand I | 180,00 | 0,06 | 0,84 | C | A |
| Brand J | 165,00 | 0,05 | 0,89 | C | C |
| Brand K | 130,00 | 0,04 | 0,93 | C | B |
| Brand L | 120,00 | 0,04 | 0,97 | C | A |
| Brand M | 80,00 | 0,03 | 1,00 | C | C |
| Total | 3 075,00 | 1,00 |
| Brand, SKU | Brand turnover, thousand rubles. | Layout, linear. meters | Shelf number | Merchandising Index, Im | Share of space on the shelf, K | Comparable values | Share in comparable amounts |
Share with cumulative total |
Group, according to the results of ABCi analysis |
|---|---|---|---|---|---|---|---|---|---|
| Brand L | 120,00 | 0,50 | 1 | 1,4 | 0,02 | 8 400 | 0,162129745 | 0,162129745 | A |
| Brand G | 230,00 | 1,00 | 5 | 1,2 | 0,04 | 6 900 | 0,133178005 | 0,29530775 | A |
| Brand I | 180,00 | 1,00 | 1 | 1,4 | 0,04 | 6 300 | 0,121597309 | 0,416905059 | A |
| Brand F | 250,00 | 1,00 | 2 | 1 | 0,04 | 6 250 | 0,120632251 | 0,53753731 | B |
| Brand K | 130,00 | 1,00 | 1 | 1,4 | 0,04 | 4 550 | 0,087820279 | 0,625357588 | B |
| Brand B | 380,00 | 2,00 | 4 | 0,8 | 0,08 | 3 800 | 0,073344409 | 0,698701997 | B |
| Brand C | 340,00 | 1,50 | 3 | 0,6 | 0,06 | 3 400 | 0,065623944 | 0,764325941 | B |
| Brand H | 220,00 | 2,50 | 1 | 1,4 | 0,10 | 3 080 | 0,059447573 | 0,823773515 | C |
| Brand A | 420,00 | 3,00 | 4 | 0,8 | 0,12 | 2 800 | 0,054043248 | 0,877816763 | C |
| Brand J | 165,00 | 2,00 | 2 | 1 | 0,08 | 2 063 | 0,039808643 | 0,917625406 | C |
| Brand E | 270,00 | 4,00 | 5 | 1,2 | 0,16 | 2 025 | 0,039084849 | 0,956710255 | C |
| Brand D | 290,00 | 3,50 | 3 | 0,6 | 0,14 | 1 243 | 0,023988585 | 0,98069884 | C |
| Brand M | 80,00 | 2,00 | 2 | 1 | 0,08 | 1 000 | 0,01930116 | 1 | C |
| Total | 3 075,00 | 25,00 | 1,0 | 51 810 | 1 |
The seminar participants first conducted a classic ABC analysis with a merchandising index (Table 4). After that, fill out the table. 5, where we added turnover, linear meters, and shelf number for the product item. The merchandising index was calculated using the formula given above, taking into account 5 shelf space. The comparable values column was calculated as follows:
trade turnover · merchandising index: percentage of shelf space.
Based on the data obtained, a classic ABC analysis was then carried out, where the share was then calculated in comparable values and with a cumulative total, and based on its results, each brand was assigned a group. Participants then compared the results of the classic ABC analysis with the ABC analysis with the merchandising index. If a product item received a different group according to the results of two analyzes (for example, in one A, and in the other - B), this means that it takes up too much space on the shelf. This discrepancy must be used in negotiations with distributors, reducing the display of goods and changing the number of its shelf.
| Brand | Brand turnover, rub. | Brand display, cm | EPP, rub. | <ЕПП | >EPP | Sufficiency, cm | Extra, see | Distribution, cm | Brand display 2, cm | EPP 2, rub. | Trade turnover of brand 2, rub. |
|---|---|---|---|---|---|---|---|---|---|---|---|
| Brand A | 7 800 | 260 | 30,0 | 26,3 | 0,0 | 139 | 121 | 0 | 139 | 56,3 | 7 800 |
| Brand B | 4 600 | 100 | 46,0 | 10,3 | 0,0 | 82 | 18 | 0 | 82 | 56,3 | 4 600 |
| Brand C | 12 000 | 160 | 75,0 | 0,0 | 18,7 | 0 | 0 | 37 | 197 | 75,0 | 14 812 |
| Brand D | 5 400 | 120 | 45,0 | 11,3 | 0,0 | 96 | 24 | 0 | 96 | 56,3 | 5 400 |
| Brand E | 16 000 | 200 | 80,0 | 0,0 | 23,7 | 0 | 0 | 48 | 248 | 80,0 | 19 801 |
| Brand F | 6 000 | 200 | 30,0 | 26,3 | 0,0 | 107 | 93 | 0 | 107 | 56,3 | 6 000 |
| Brand G | 12 000 | 160 | 75,0 | 0,0 | 18,7 | 0 | 0 | 37 | 197 | 75,0 | 14 812 |
| Brand H | 9 600 | 160 | 60,0 | 0,0 | 3,7 | 0 | 0 | 7 | 167 | 60,0 | 10 048 |
| Brand I | 6 600 | 100 | 66,0 | 0,0 | 9,7 | 0 | 0 | 19 | 119 | 66,0 | 7 886 |
| Brand J | 4 400 | 40 | 110,0 | 0,0 | 53,7 | 0 | 0 | 108 | 148 | 110,0 | 16 231 |
| Total | 84 400 | 1 500 | 56,3 | 128 | 257 | 257 | 1 500 | 107 391 |
Matrix analysis
Matrix analysis allows you to make a decision on excluding a position from the assortment, as well as on the redistribution of resources (shelf and retail space) between product items included in the same category. Matrix analysis is carried out both by category and by groups of homogeneous goods (types, brands, etc.) At the first stage of the analysis, all product items are compared according to two characteristics:
- The Y-axis shows the weekly (monthly) growth rate of turnover of a specific SKU;
- The X-axis shows the relative share of turnover (RPT) of the SKU (the ratio of the turnover of the SKU to the turnover of the sales leader in the group).
The ODT share is calculated as follows: the sales volume of the product item under study is divided by the sales volume of the leader in a particular segment.

As a result, each product item (SKU) falls into one of four sectors (Fig. 4):

Sector A - high CCT and growth rates of trade turnover (increase in trade turnover - above 1/4 in the trading network; CCT - above 0.6).
Sector B - large market share and relatively stable growth rates (trade turnover growth - below 1/4 of the retail network; CCT - above 0.6). The cash flow they generate significantly exceeds investment needs. But since most of them have moved down from sector A, they maintain a downward trend in the growth rate of trade turnover. Therefore, the manager’s primary task is to smooth out this trend for as long as possible.
Sector D - outsider goods (increase in trade turnover - below 1/1 in the trading network; CCT - below 0.6). The support of these products is justified to the extent that their existence is consistent with the concept of the trade assortment (specialization of the enterprise, image, desire to give the assortment special properties). However, since these elements are at the final stage of the life cycle, they are the ones that are subject to exclusion in the event of underfunding of any of the sectors of the matrix analysis.
Sector C - high growth rates and insignificant trade turnover (increase in trade turnover - above 1/4 in the retail network; CCT - below 0.6). These products have high financing needs and low income levels (due to an undeveloped sales market). Since not all of the elements presented in field B will be able to move into sector A, the question arises of how justified the financing of a particular element is.
Depending on how the goods behave in the matrix (coordinates along the matrix axes increase or decrease; CCT and trade turnover increase or decrease, etc.) compared to the previous period, all elements are assigned one of the financing lines:
1st line - funding priority. Receiving the 1st line of financing involves an increase in the retail and exhibition space allocated for the product (minimum, with a coefficient of 1.7); increasing the number of faces in a display; duplication of goods at additional points of sale, etc.
2nd line - financing of the product item remains unchanged. The amount of resources that the product received in the previous period, it continues to receive in the planned period.
3rd line - financing of goods is reduced to the initial level (to the level prior to the appearance of the 1st line of financing). The display area and the number of facings are reduced, and the product is removed from additional points of sale.
4th line - the product is being prepared for removal from the matrix (possibly temporary). The manager stops placing orders for this product, the remaining balances are sold online.
5th line - the product should be excluded from the assortment matrix (before the onset of the season), unless it is an image product.
6th line - appears for the product only if the product was not on sale for some reason. The appearance of the 6th line requires further investigation.
The decision to exclude a product item cannot be made when only one “5” appears. The manager makes a decision to increase funding or exclude a product based on the results of 4–6 weeks, analyzing the current trend.
The seminar participants also calculated the approximate turnover of the network for the future period, based on its format and area. Its calculation formula is:
T 2008 = (((Tm2 2007 * Sm2 2007 + Tm2 2007 * Sm2 2008 * (b-n)/12) + Inf. (%)) + RPR (%)) + Int. (%), Where, b- months remaining until the end of the year from the opening of the store; n- months allocated for store promotion; Inf.. - inflation percentage (approximately); RPR- growth of the consumer market; Int. - intensive increase in trade turnover.
Opportunities and prospects
The training participants learned how to conduct various types of comprehensive analysis of the assortment, received recommendations for optimizing the category structure, and studied modern methods of assortment management, methods of its analysis and optimization.
It is impossible to talk about such a voluminous topic as product assortment management in one publication. You can get practical lessons on CM at this kind of training. To be fair, it should be said that today there is very little comprehensive information in the public domain regarding CM in the pharmacy business. This is easily explained by the competition in this segment. However, one thing is clear - independent and painstaking work in studying the intricacies of CM will become an invaluable tool for pharmacy specialists in sales management.
Oksana Sergienko
Facing is a unit of product laid out frontally on a shelf, with the front side facing the buyer.
Facing is a unit of product that is visible (in self-service stores - accessible) to the buyer. Thus, each assortment item can occupy several facings at the point of sale. But it is necessary to distinguish between facings and product stock on the shelf for each position
Setting goals for shelf space- this is the determination of the number of facings that the manufacturer wishes to present at the point of sale.
It should be noted that facing has two functions: demonstration and shelf space retention function. Depending on the tasks that the manufacturer sets for itself, one of the functions comes to the fore.
The first and most obvious reason to set shelf space goals is to optimize turnover rate (shelf space retention function). Most often, such decisions need to be made for self-service stores, where the buyer is left alone with the product. The goal is to ensure a uniform loss of goods from the point of sale and ensure a probability close to 100% that each customer will leave with a purchase.
The primary and simple requirement should be the following: the facing of priority positions should be greater than the facing of the main and additional ones. This will allow the product to leave the shelf evenly, which will reduce the labor costs of sellers and merchandisers to maintain the display.
In foreign merchandising practice there is the following rule: SPACE TO SALE. It says that the brand should occupy the same percentage of shelf space as it occupies in sales of all goods displayed in a certain area. If 1 package of plum juice sells 3 cherries and 10 oranges, then approximately the same proportions must be maintained in facings so that all customers find the right product at any time they are in the store.
However, this is where fast-moving goods often fall into a bit of a trap. If priority positions are given as much space as they are entitled to in proportion, then perhaps there will simply be no room left for additional positions. Therefore, on the store shelf for the example above, we will most likely see 1 face of plum juice, 2 faces of cherry juice and 4 faces of orange. This adjustment is necessary to ensure that buyers of additional assortments also find their product. But you will have to “pay” for such an adjustment. The seller or merchandiser will need to replenish the stock of priority items more often. In the long term, this approach justifies itself in those stores where the emphasis is on a wide range. In other stores, the decision to reduce the number of SKUs in favor of increasing the facing of priority and main positions has a simple explanation. The lesser of two evils is chosen - it is better to lose one buyer of plum juice than to lose 6 buyers of orange juice.
It should be noted that sales analysis and shelf space allocation decisions are much more complex. What is SALE in the SPACE TO SALE rule? Some people mean market share, some mean a share in turnover, some mean a share in profit. In my opinion, it is necessary to take the share of profit (total margin) as a starting point.
The second reason for setting shelf space goals is to increase the visual perception of products at the point of sale (Visibility). Here, facing performs a demonstration function. From this point of view, this tool is necessary for all stores, regardless of the service mode.
What is a high visual perception of a product at the point of sale? This is the case when, when approaching a point of sale, the buyer first of all sees this specific product (brand block, packaging, etc.) From the point of view of the store, high visual perception allows customers to easily notice all the products present at the point of sale. To achieve this goal, various grouping and blocking techniques are used.
It is known that a person can perceive information quite consciously in a field that is 30 degrees from the point where his gaze is focused. If a person moves along the point of sale to study the assortment presented, then these conditional 30 degrees also move. If a company wants to take a visually dominant position at the point of sale, then it is necessary to fill a space exceeding 30 degrees with its products. Within this space, incremental facing will have great effect.
But the further we go beyond this space, the less effect each added face will bring. Therefore, sometimes companies set themselves the goal of achieving a specific number of faces at the point of sale of one brand. Since all packages of one brand most often have the same design style, that same spot of color is created that instantly attracts attention.
The initial saturation of the demand of domestic buyers occurred through extensive methods of developing retail trade, such as expanding retail space or increasing the assortment. Modern economic realities contribute to the introduction of intensive retail business development programs through more efficient use of retail space or. Thus, shelf space has become a tool for intensifying the growth of trade turnover.
Nowadays, the art of selling a product directly depends on how competently the sales staff shows the product “face to face”, or, as merchandisers say, how many faces of each SKU can be placed on the “golden shelf” of the sales floor. "" stores consider the retail space to be the most convenient for purchasing goods, located at the level of the buyer's eyes and hands, that is, at a height of 1.2 - 1.7 m from the floor. “Golden Shelves” are the most effective retail space and sell goods without a seller. Also, the most profitable retail space includes shelves to the right of the planned customer flow.
The distribution of shelf space for product categories and assortment groups is carried out by category managers or merchandise experts and middle management staff of the store. Together with merchandisers, they organize the display of goods on retail equipment. Assortment items (SKU) can be divided into priority, basic and additional according to the degree of product turnover. The most popular positions are a priority, the main ones include positions that stably retain a large number of regular customers; additional positions have a low turnover, but they have their loyal customers. When distributing shelf space by position, the percentage ratio will be 20:60:20. Next, when distributing shelf space, the number of facings is determined. To solve the problem of uniform decrease of goods from the shelf, the correct arrangement of facing of assortment positions is required; the facing of priority positions must be greater than the facing of the main and additional ones.
With a large assortment of goods, complete facing is impossible and then it makes sense to remove behind the counter those SKUs that are unlikely to be purchased on impulse, and put the goods of basic demand on the counter. There is a fairly wide range of products that are not sold without facing; in this case, the task is to optimize the assortment for more efficient use of shelf space.
To solve the problem of managing shelf space, it is necessary to study consumer demand, partners, retail equipment and much more, which makes up the daily work of a store manager, the realization of internal reserves and, as a rule, an increase in turnover and profit growth.


